
Analytics: The Metrics That Actually Matter
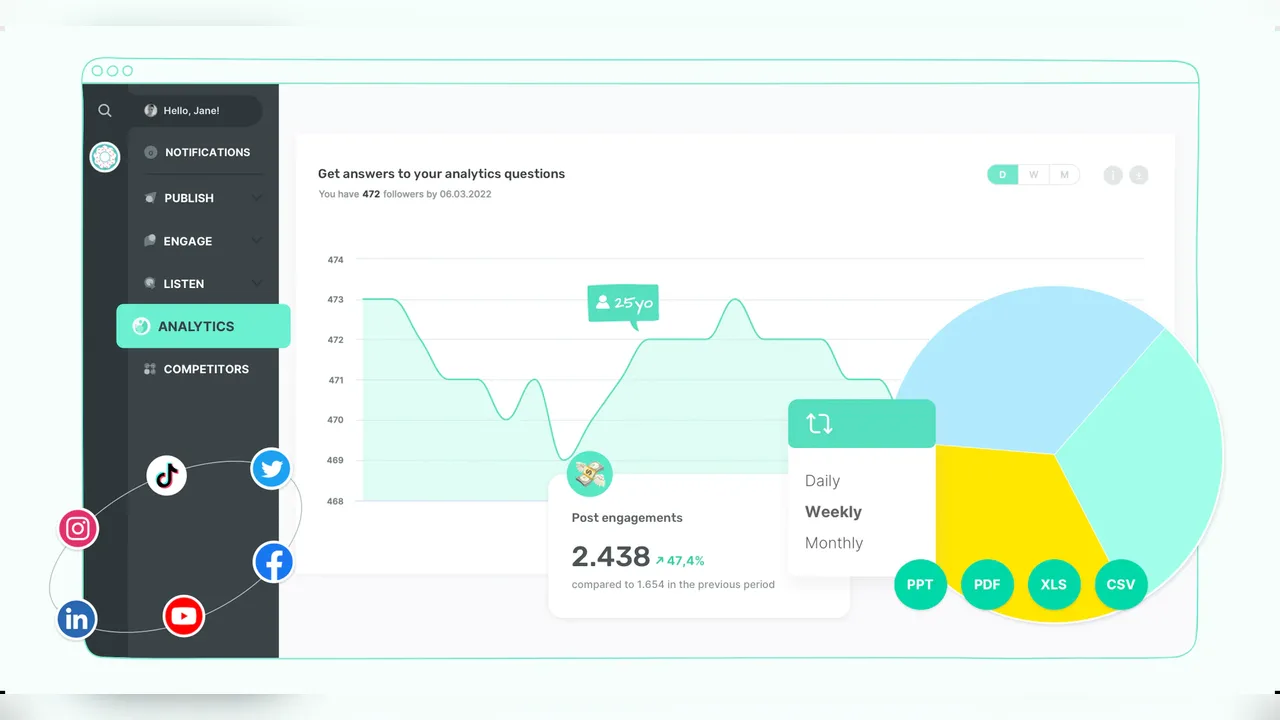
Exo Booster app page argues for honest numbers, and analytics dashboards make honesty hard by showing everything at once. Most metrics are noise for a small account, and chasing them all guarantees confusion.
This post narrows the dashboard to five metrics that drive decisions, and explains what each one should change.
The five metrics
Reach shows how many people saw the content. Retention shows how much they watched or read. Saves and shares show value worth keeping or passing on. Conversions show whether attention became a follow, visit, or sale. Together they describe the whole funnel.
Everything else, including raw likes and total followers, is context. Useful context, but a poor decision maker on its own.
Reading them together
High reach with low retention means the hook or packaging misled viewers. Low reach with high retention means a strong post that needs better discovery, such as a better topic or format. High saves with low follows means valuable content with a weak profile or call to action.
Each pattern suggests a different fix, which is why single metric goals fail. engagement in context and retention on video show the same logic per platform.
A weekly analytics habit
Once a week, record the five metrics for the best and worst post, and write one sentence about why each performed that way. After a month, patterns appear that no dashboard summary will hand over.
Then change one thing per week based on the pattern. Creators who change everything at once learn nothing, because they cannot tell which change worked.
Track reach, retention, saves, shares, and conversions. Five honest numbers beat fifty decorative ones. The service file status is listed on the download page.

Lead APK Reviewer. Lena checks app and service claims on real Android phones before they are published here.